10min
read
Welcome to the second part of our overview of Cloud Infrastructure Monitoring and Alerting. As a reminder, part one talks about the importance of monitoring in cloud environments, if you did not read it yet, here it is.
With the exponential growth of cloud infrastructures, the need to proactively and efficiently monitor deployed resources is becoming crucial. Several monitoring solutions offer varied functionality, diverse data collection capabilities and distinct approaches to meet the specific needs of organizations. In this section, we take a comparative journey through some of the most prominent cloud monitoring solutions, exploring their features, benefits, drawbacks and relevant selection criteria.
Each solution plays an essential role in guaranteeing the performance, security and availability of cloud services. However, the diversity of offerings makes a thorough examination crucial, going beyond technical features to encompass aspects such as pricing, scalability, multi-cloud integration and ease of use. Our comparison aims to provide a holistic view, informing strategic decisions for organizations seeking to create and maintain robust, efficient cloud infrastructures.
The 3rd article will focus on the metrics to be targeted for effective monitoring, and the best practices to be put in place to guarantee the effectiveness of continuous infrastructure monitoring.
Monitoring tools on the market
Without further ado, here are the main tools on the market. However, bear in mind that these tools are more or less adapted to the needs of your infrastructure, depending on a number of criteria which, when combined, make it difficult to make an absolute recommendation. We'll try to shed some light on these criteria and important considerations, so that you can get a clearer picture. We'll also take a look at trends in user reviews of these tools.
1. Tools
1.1. Amazon Web services
1.1.1. Amazon CloudWatch
Amazon CloudWatch is AWS' native monitoring service, offering in-depth visibility of deployed resources. It collects real-time performance data, such as CPU metrics, network bandwidth and database performance. CloudWatch lets you create customized dashboards, configure alarms for specific events and analyze logs for early detection of issues.
Positive trends :
- Native integration with AWS services.
- Comprehensive monitoring and alerting capabilities.
- Scalability to adapt to environments of any size.
Trends to consider:
- Some users have noted an initial learning curve to take full advantage of all features.
1.1.2. AWS Config
AWS Config goes beyond simple monitoring by providing a historical view of the configuration of AWS resources. It tracks configuration changes, helping to address compliance and security issues. AWS Config also offers the option of creating customized compliance rules to maintain optimal configuration.
Positive trends:
- Configuration history: Users appreciate the ability to track configuration changes over time, facilitating auditing and compliance.
- Compliance Rules: The ability to define custom compliance rules is often highlighted, enabling organizations to maintain specific standards.
- Integration with other AWS services: Seamless integration with other AWS services, such as CloudWatch, for monitoring configuration changes.
Trends to consider :
- Cost: Some users note that the costs associated with AWS Config can increase, particularly in large-scale or complex environments.
- Initial configurations: Initial configuration may require in-depth planning and understanding of the organization's specific needs.
1.2. Microsoft Azure
1.2.1. Azure Monitor
Azure Monitor is a comprehensive suite of monitoring tools for applications and services deployed on Azure. It offers detailed metrics, activity logs and advanced diagnostic features. Azure Monitor can be extended with features such as Application Insights for detailed monitoring of application performance.
Positive trends:
- Native integration with Azure services.
- Complete monitoring of metrics and logs.
- Advanced features such as Application Insights for applications.
Trends to consider :
- Some users note that pricing can become complex on a large scale.
- Certain aspects of the initial configuration may require special attention.
1.2.2. Azure security center
Azure Security Center focuses on the security of cloud infrastructures. It provides security recommendations, detects potential threats and offers a centralized view of the state of security in the Azure environment. Advanced features include vulnerability detection, threat management and incident response.
Positive trends:
- Advanced threat detection and compliance.
- Seamless integration with other Azure services.
- Advanced security features.
Trends to consider :
- Costs may increase with the use of advanced features.
- Integration with non-Azure environments may require specific configuration.
1.3. Google Cloud Platform
1.3.1.Stackdriver
Stackdriver is GCP's monitoring and diagnostic tool. It provides real-time visibility into performance, availability and logs. Stackdriver Monitoring lets you create customized dashboards, issue alerts and analyze traces in depth to optimize performance.
Positive trends:
- Native integration with GCP services.
- Real-time monitoring and metrics collection.
- Advanced features for container monitoring.
Trends to consider:
- Some users report an initial learning curve.
- Some aspects of pricing may be perceived as complex.
1.4. Multi-cloud tools
1.4.1. Datadog
Datadog is a multi-cloud monitoring solution that centralizes performance, log and security monitoring. It supports a variety of cloud services and technologies, offering unified visibility and advanced analysis capabilities.
Positive trends:
- User-friendly interface.
- Multi-cloud support.
- Advanced features such as log and security analysis.
Trends to consider:
- Costs may increase with high data volumes.
- Some advanced features may require a learning curve.
1.4.2. Prometheus and Grafana
Prometheus is a widely used open-source tool for monitoring containers and cloud-native environments. It collects metrics efficiently, offers flexible queries and supports real-time alerting.
Grafana is an open-source platform that often works in tandem with Prometheus and other data sources. It enables the creation of visually appealing and customizable dashboards, offering a centralized and comprehensible view of metrics and monitoring data.
Positive Trends:
- Suitable for cloud-native environments, including Kubernetes.
- Open-source and highly customizable.
- Highly flexible for collecting metrics and creating dashboards.
Trends to consider:
- Requires extensive initial configuration.
- Scalability management may require special attention in large infrastructures.
1.4.3 Dynatrace
Dynatrace is an intelligent monitoring solution that provides in-depth visibility into the performance of applications and cloud infrastructures. Using AI, Dynatrace automates anomaly detection, provides real-time insights and facilitates proactive problem resolution.
Positive Trends :
- Proactive monitoring using artificial intelligence.
- Extended support for cloud environments and technologies.
- Automated problem detection and resolution.
Trends to consider:
- Potentially high cost for some organizations.
- Some configurations may require in-depth expertise
1.5. Important considerations
- Integration: Choose tools that are compatible with existing APIs and services in your infrastructure.
- Scalability: Ensure that tools can evolve to support new cloud services and future growth.
- Security: Opt for tools that integrate advanced security features, such as identity management and access auditing
1.6. Global notice
- Flexibility and adaptability: Users generally appreciate tools that offer a high degree of flexibility and that can be adapted to different cloud architectures and technologies.
- Costs: The costs associated with using these tools, particularly on a large scale, are often a point of discussion. Some organizations may be attentive to pricing based on the volume of data processed.
- Community support: Tools with an active community and robust support tend to be better valued.
For the most up-to-date reviews, I recommend consulting review platforms such as G2, TrustRadius, or tool-specific community forums.
In conclusion, the choice of specific tools depends on your organization's particular needs. Investing in solutions that offer in-depth visibility and are tailored to your cloud environment will contribute to effective monitoring and proactive resource management.
The comparison
2.1 Technical aspect
Here's a tabular comparison of some cloud infrastructure monitoring tools we've mentioned:
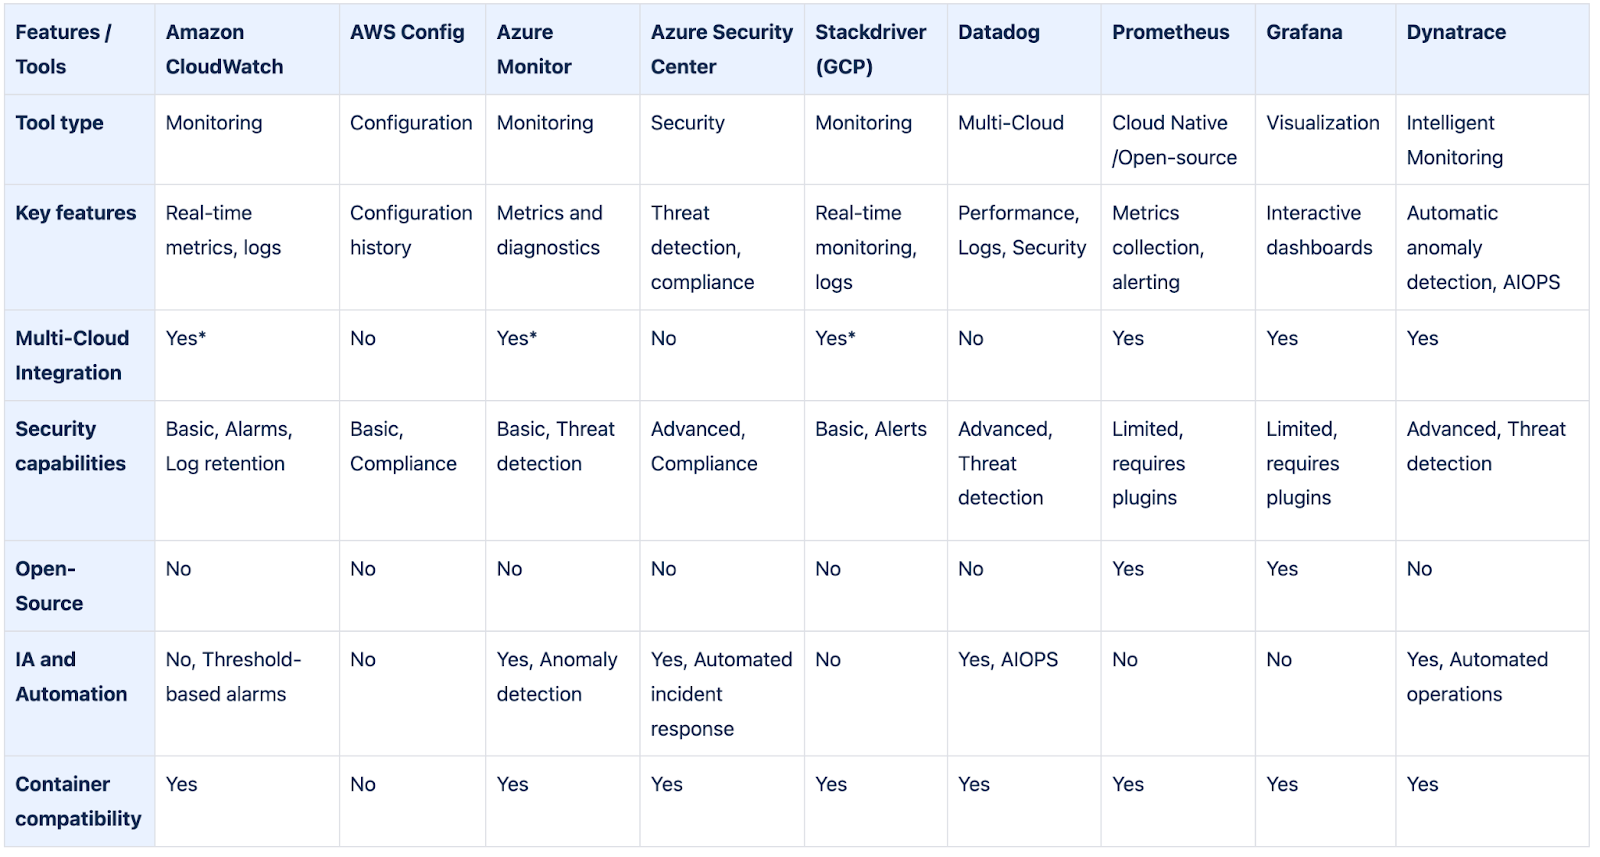
* Non-native integration, requires knowledge to adapt to multi-cloud or hybrid infrastructure
This table provides a general overview of the features of each tool, but it's important to note that the choice of tool will depend heavily on the specific needs of your infrastructure, the complexity of your cloud environment, as well as priority features such as security, ease of use and multi-cloud integration.
2.2 Financial aspects
Drawing up an accurate financial comparison for cloud infrastructure monitoring solutions can be complex, as costs vary depending on a number of parameters specific to each organization. However, here's an analysis based on a few key criteria:
Amazon CloudWatch (AWS):
- Usage-based pricing:
- Metrics: Charges apply according to the number of metrics collected.
- Logs: Costs are based on the volume of logs ingested and queries executed.
AWS Config (AWS):
- Usage-based pricing:
- Compliance rules: Costs depend on the number of active rules.
- Saved configurations: Costs are linked to the number of configurations under management.
Azure Monitor (Microsoft Azure):
- Usage-based pricing:
- Metrics and Logs: Costs are associated with the volume of data collected.
- Application Insights: Specific pricing may apply.
Azure Security Center (Microsoft Azure):
- Usage-based pricing:
- Costs are linked to threat detection, vulnerability management and compliance.
Stackdriver (Google Cloud Platform):
- Usage-based pricing:
- Metrics, traces and logs: Costs depend on the volume of data collected.
Datadog:
- Usage-based pricing:
- Costs are generally linked to the volume of metrics, traces and logs processed.
- Flat rates are available for different levels of service.
Prometheus and Grafana:
- Open-Source:
- These solutions are free to use, but the infrastructure costs must be taken into account.
Dynatrace:
- Usage-based pricing :
- Costs may be linked to the number of hosts or processing units.
- Additional costs may apply for specific features.
For an accurate estimate, we recommend :
- Assess your specific needs: Determine the amount of data you plan to collect and the functionality you require.
- Consult suppliers' pricing pages: Examine the pricing details for each service, taking into account the different tariff components.
- Contact supplier representatives: If necessary, contact suppliers directly to obtain information specific to your use case and discuss any special requirements.
Due to the variety of pricing models and specific needs, it's difficult to provide an accurate estimate without a detailed analysis of your environment and requirements.
Technofy, as a consulting company specializing in Cloud and DevOps services, can assist you in this process. Our team of experts can conduct a thorough assessment of your infrastructure and requirements, provide recommendations tailored to your needs, and help you navigate the complexities of cloud pricing and DevOps practices. By leveraging our expertise, you can make informed decisions and achieve optimal outcomes for your business.
Conclusion
As companies move towards more complex cloud architectures, infrastructure monitoring becomes an essential pillar for ensuring optimal performance, enhanced security and constant availability of deployed services. Our detailed comparison of monitoring solutions has highlighted the diversity of tools available, each bringing its own unique set of features, capabilities and approaches.
It is imperative to recognize that each cloud architecture has its own specific characteristics and requirements. Amazon CloudWatch, Azure Monitor, Stackdriver, Datadog, Prometheus, Grafana and Dynatrace offer diverse solutions for different usage scenarios. So it's essential to choose the solution that best aligns with the particular needs of your infrastructure.
As the world of cloud infrastructure monitoring is constantly evolving, it's just as crucial to remain flexible in adapting your monitoring strategy. Cloud-native architectures, such as container support, require solutions like Prometheus, specifically designed to integrate seamlessly with these dynamic environments.
Finally, it's important to recognize that the effective implementation and management of these solutions often requires specialized know-how. If your organization doesn't have in-house skills dedicated to cloud monitoring, it's strongly recommended that you enlist the help of experts. Specialized consultants can guide your team through the configuration, optimization and ongoing management of the chosen monitoring solution, ensuring optimal use of cloud resources.
In conclusion, adapting the monitoring solution to each cloud architecture is the key to success in a constantly changing IT landscape. Investing in the right solution, tailored to your specific needs, and surrounding yourself with qualified experts for implementation, are essential steps in ensuring the robustness, security and performance of your cloud infrastructures.
Bonus
Here are two separate case studies, one focusing on AWS with applications deployed on EC2 servers and the other on Amazon EKS (Elastic Kubernetes Service), a Kubernetes container management solution on AWS.
Case Study 1: Monitoring Applications Deployed on EC2 Servers (AWS)
Context: A company hosts a web application on AWS EC2 servers. The application consists of several components, including a web server, a database, and a backend service.
Challenges:
- Ensure continuous application availability.
- Monitor EC2 server performance, including CPU usage, memory and network traffic.
- Quickly identify and resolve performance or downtime issues.
Solution:
- Amazon CloudWatch: Use CloudWatch to monitor EC2 server metrics, issue alerts when thresholds are exceeded, and create customized dashboards for a consolidated view of performance.
- Amazon CloudWatch Logs: Collect EC2 server logs for in-depth analysis of errors, important events and performance monitoring.
- AWS CloudTrail: Track actions performed on AWS resources, ensuring traceability for security and compliance.
Case Study 2: Monitoring Applications Deployed on Amazon EKS
Context: A company is migrating its infrastructure to containers and using Amazon EKS to orchestrate and manage its Kubernetes clusters.
Challenges:
- Guarantee the performance and availability of containerized applications.
- Monitor EKS cluster and Kubernetes pod resources.
- Identify problems specific to cloud-native environments, such as automatic pod scaling.
Solution:
- Amazon CloudWatch Container Insights: Collection of Kubernetes-specific metrics and logs, enabling detailed monitoring of EKS resources and containers.
- Prometheus and Grafana: Use of Prometheus for metrics collection and Grafana for visualization, providing an open-source solution for cloud-native environments.
- AWS App Mesh: Integration of AWS App Mesh to manage traffic between services, providing greater visibility of communications between microservices.
These two case studies clearly illustrate that every cloud architecture, whether traditional EC2 servers or cloud-native environments such as EKS, requires a suitable monitoring solution. Amazon CloudWatch proves effective for traditional deployments, offering native integration and comprehensive functionality. On the other hand, the Prometheus and Grafana-based approach is proving crucial for fine-grained monitoring of Kubernetes clusters, underlining the need for specialized solutions in cloud-native environments.
This conclusion demonstrates the importance of choosing monitoring tools according to the specifics of the cloud architecture deployed. Each solution has its own distinct advantages, and adaptation to the particular needs of each environment is essential to guarantee effective, proactive monitoring. Investing in and maintaining appropriate solutions is the key to maintaining optimum performance and ensuring continuous application availability.
Join us in the third and final article of this series: Choosing metrics and implementing best practices for effective monitoring.
Thank you for reading this article. We hope you enjoyed it!
Contact us for more information about our accompaniment and expertise !